“If you’re early on in your career and they give you a choice between a great mentor or higher pay, take the mentor every time. It’s not even close. And don’t even think about leaving that mentor until your learning curve peaks.” Stanley Druckenmiller

Math Modeling as a Performing Art
Statistics and math modeling turn ordinary humans into superheroes with the gift of x-ray vision. In so many messy, real-world situations, the only way we can “see” the problem or possible solutions is by modeling available data, making patterns visible and data-driven decisions possible. It is mathematical modeling that has allowed experts and the general public to “see” the coronavirus pandemic: a very large problem posed by a very small threat. The novel coronavirus is an invisible 60–140 nm pathogen. One nm is a billionth of a meter or a millionth of a millimeter. One millimeter is already very small, about the diameter of the lead in a wooden pencil. Not a day goes by that the public has not heard about the only way we can win the “war” against this novel coronavirus is the flatten the curve. The curve is the visualization of a math model.

Imagine, for a moment, the variables that might affect outcomes for this virus landing on US shores. 330,000,000 people in America live in 50 states and additional territories in cities and towns with varying population densities. Health issues vary with economic status and geographical locations. Millions of people have no health insurance. Millions have no savings to weather even a $400 unexpected expense, much less the thousands of dollars it costs to visit hospitals or the money to buy groceries and pay rent without a regular paycheck. Each model cannot take into account every variable so decisions must be made.
Scientists and other business leaders who use math modeling understand the value of models while being cognizant of their limits. The accuracy and relevance of data inputs determine the reliability of a model. As more data becomes available, models are adjusted. Assumptions also affect the outcomes of mathematical models. For example, predicting the availability of essential resources like hospital beds or ventilators for treating Covid-19 patients was based on hard data about available beds in each state, but on assumptions of how much mitigations such as social distancing would affect the need for those beds. As data of current hospitalizations and patients placed in ICU and on ventilators was added to data that came in from other countries, the model was adjusted. The effects of mitigation was better understood and original assumptions were adjusted within the model. Models are matched to make sure they reflect reality as we know it and adjusted as additional data is collected. They are not static tools.
It has been evident from news coverage and from comments on social media that modeling is not a well-understood or appreciated by the general public. Math models are emphasized in the common core mathematics standards and for most of my career, I have worked to teach statistics, math modeling, and data-driven decision making to K-12 students and teachers. The technology today in the form of simulations, graphing calculations, and spreadsheets make the mathematics behind such models accessible to most people. Even if they are not able to create the models, they can work with them, manipulate variables and play “what if” using the models. After seeing how difficult it has been for people to grasp the information presented to them with respect to this national emergency, it is more important than ever that we concentrate time on teaching this graphic mathematical language.
I followed the news reports and listened to people assume the most popular health institute models were incorrect or artificially inflated as the expected deaths or actual use of ventilators or beds was less than the original projections. We may have needed 30,000 ventilators if social distancing had not been done or had not worked but maybe there is another explanation for why the number of ventilators needed was lower than initially modeled. I would like to offer one last example of how models cannot be expected to anticipate every variable that might affect their assumptions. Innovation happens in unexpected times and places. In this case it was in overwhelmed hospitals in NY during the coronavirus.
Apr 14, 2020 – Ventilators: The innovative changing stories behind the model This headline caught my attention: What Doctors on the Front Lines Wish They’d Known a Month Ago …www.nytimes.com ›

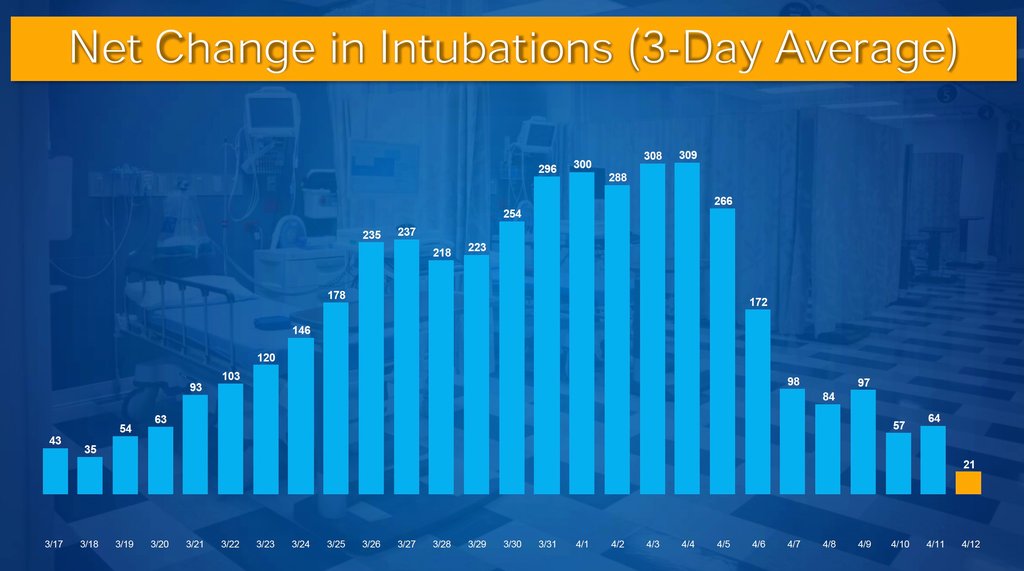
Now, doctors in the region started sharing on medical grapevines … Some patients, by taking oxygen and rolling onto their sides or on their stomachs… At Lincoln Hospital in the Bronx, Dr. Nicholas Caputo followed 50 patients who arrived with low oxygen levels between 69 and 85 percent (95 is normal). After five minutes of proning, they had improved to a mean of 94 percent. Over the next 24 hours, nearly three-quarters were able to avoid intubation; 13 needed ventilators. The original assumption based on experiences in other countries was that severe cases would require ventilators for survival. With experience, doctors learned that was not the case with US patients.

Teaching this kind of data-driven thinking and decision making is vital for the success of today’s students. They must practice and become nimble at this performing art, practicing it with the dedication usually reserved for sports, music or art.
References:
https://www.brainyquote.com/authors/stanley-druckenmiller-quotes
