
“If you’re early on in your career and they give you a choice between a great mentor or higher pay, take the mentor every time. It’s not even close. And don’t even think about leaving that mentor until your learning curve peaks.” Stanley Druckenmiller
Predicting the Future: Math Modeling
Wealth Inequality
Mathematical Modeling offers a way to identify patterns in large amounts of data. These patterns give us a kind of x-ray vision into very complicated, messy problems and issues. As an important tool in most careers, it is important that mathematical modeling is understood and taught in our K-12 schools. The common core curriculum required the use of math modeling at every grade level:
- Mathematically proficient students who can apply what they know are comfortable making assumptions and approximations to simplify a complicated situation, realizing that these may need revision later.
- They are able to identify important quantities in a practical situation and map their relationships using such tools as diagrams, two-way tables, graphs, flowcharts and formulas.
- They can analyze those relationships mathematically to draw conclusions.
Models are routinely updated as new data becomes available. Developers interpret the model’s mathematical results in the context of the real situation and reflect on whether the results make sense, possibly improving the model if it has not served its purpose.
For example, mathematical modeling allows economists to examine how wealth in the US and the world is distributed, identify variables that affect this distribution, and predict how this distribution might look in the near and far future. The issue of the continuing increase in wealth concentration is recognized and discussed across the globe. A decade ago the combined wealth of 388 billionaires equaled that of the poorest half of humanity, according to Oxfam International. In 2007, it took only eight billionaires, and today that number has been reduced to four billionaires.
Income and wealth are not the same things. Wealth refers to the net worth of a household. It is the sum of assets minus liabilities. Household income is merely realized income to be reported on one’s personal income tax return.
Mathematical modeling allows mathematicians and economists to examine the growth of this wealth gap and the variables that affect it, and to predict what might happen in the future.
One of the simpler modeling ideas for wealth growth is called the “Yard-Sale Model. Bruce Boghosian and a team of Tufts University mathematicians used this mathematical model of market-based exchange to investigate a theory that without redistribution, wealth becomes increasingly more concentrated, and inequality grows until almost all assets are held by an extremely small percent of people.
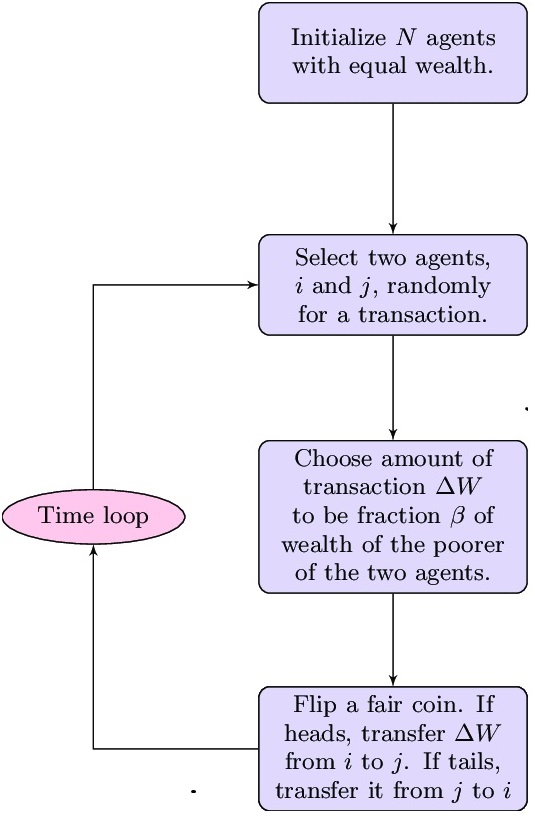
This is essentially a coin toss, and you might think that in the end both sides would end up with the same amount of wealth. But it turns out those who have more keep getting more. Even if both agents have the same wealth to begin with, one will eventually begin to dominate the other, even though the coin is fair.
This made me curious. I was able to create a fairly simple xcel sheet to investigate this distribution.
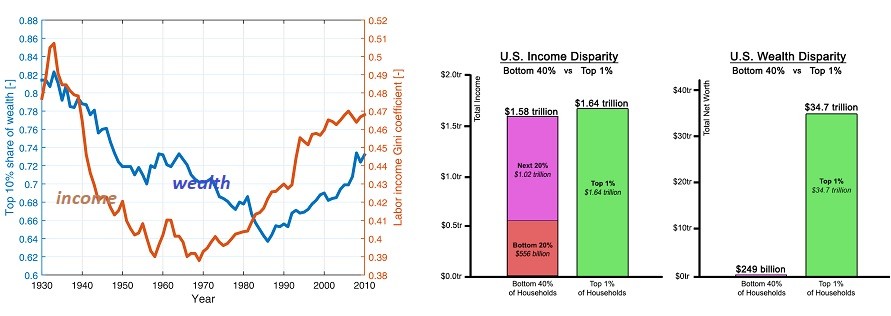
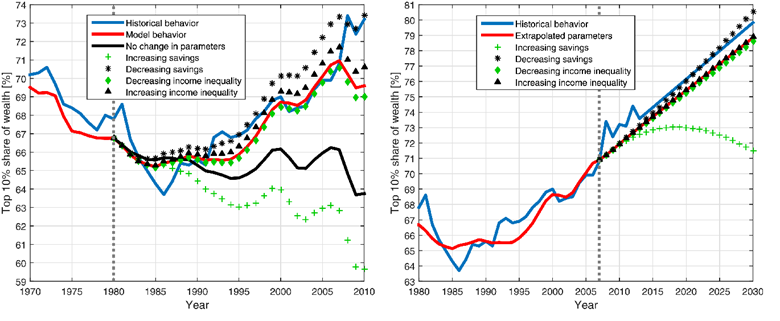
A more complicated model is based on algorithms that would be beyond the understanding of anyone not well versed in statistics and calculus but once a model is built, many users can gain insights and manipulate the inputs to make predictions. For instance, this model used existing data for Historical economic inequality in the US. The Wealth (blue) and labor income (orange) inequality (pre-taxes) in the US for 1930–2010. The wealth inequality is quantified by the share of wealth owned by the richest 10% of the population. The income inequality is measured using the Gini index is taken from Piketty and Saez and Zucman. https://doi.org/10.1371/journal.pone.0154196.g001
Using this historical data, modelers used data for variables like money saved each year and made assumptions about how savings affected wealth building to create algorithms that generates outcomes that match the historical reality. In other words, the model is mapped against reality. For instance, I could add actual savings inputs and ask for predictions for 1990 – 2010 for which I have historical data. If the outcomes of the model are reasonably close to the reality of those years, then I can assume the model is able to predict with some accuracy what might happen in the future. At this point, we can do a linear extrapolation for 2008–2030. The results for the various parameter scenarios during 2008–2030 are also presented: increasing savings scenario (green crosses), decreasing savings scenario (black stars), decreasing income inequality scenario (green diamonds) and increasing income inequality scenario (black triangles). The dotted gray line separates the calculation using historical parameter values and the prediction for future inequality. https://doi.org/10.1371/journal.pone.0154196.g005
Economical models play an important role in helping the public and experts see inside very complex problems. The patterns that emerge from large sets of data help us to see what variables affect outcomes and which ones matter the most statistically. Models are only as good as the data and assumptions and of course the math on which they are based.
In looking at economic models, I have learned more about how quickly an economy can turn toward oligarchy with one or only a few holding so much wealth that all power is dominated by that person or group.
It is important that students and teachers play with mathematical models. With technology available to the general public in the form of computer spreadsheets, apps and graphing calculators, playing “what if” and making predictions with math modeling is possible for most people. Since this tool, this performing art that is only mastered through practice, is used extensively in almost every industry, understanding how to make data driven decisions with modeling should be a priority in middle and high school classrooms.
References:
Rattner, Steven (January 22, 2018). “Opinion – The Market Isn’t Bullish for Everyone”. The New York Times. March 23, 2018.
https://now.tufts.edu/articles/mathematics-inequality
https://doi.org/10.1371/journal.pone.0154196.g005
https://doi.org/10.1371/journal.pone.0154196.g001
Hi, this is a great comment on why more people need to understand the art of math modeling.